Google’s Core Web Vitals – Top 3 Metrics to Measure User Experience!

Google launched the Web Vitals as a uniform evaluation basis for websites in May. Now Google explains how these are measured.
Google used a number of different tools and metrics in the past to analyse websites. In order to finally create a uniform standard, Google introduced the Web Vitals in May. These three factors indicate website stability, loading time, and interactivity.
Google accesses real user data (e.g. from the Chrome user experience Report) and laboratory data that is collected during rendering to collect the Web Vitals. A Google User Agent is always used. If a website uses dynamic rendering, the creation of static HTML can cause slight delays. Caching and warming up can prevent the cache beforehand. Google points out that the performance of users and Google Bot could be different.
Therefore, website operators shouldn’t rely solely on Google bot data. It’s also not enough to rely on tools like PageSpeed Insights or Lighthouse. These work with laboratory data that provide hypothetical performance data for a perfect environment. They therefore don’t represent the actual user experience, but provide starting points for more in-depth analyses.
Google recommends site operators to use the report on the Web Vitals in the Google Search Console. Even, if the user data for each URL is also not available.
Core web vitals: Google’s key figures for evaluating the user experience explained
Google wants to establish a uniform evaluation basis for the user experience of website under the name Web Vitals. We explain to you how the three Web Vitals key figures are made up.
From the Chrome Dev Tools to Lighthouse and PageSpeed Insights to the speed report in the Search Console; over the years, Google has developed a number of options for measuring the performance of a website. Basically, this is not surprising; after all, it is an important key figure in terms of user experience. In a blog post, however, Google admits that the large number of different tools and metrics causes problems of its own. In turn, Google wants to solve this in the future with a standardized rating system called Web Vitals.
Core web vitals essentially consists of 3 key figures

Largest Contentful Paint (LCP):
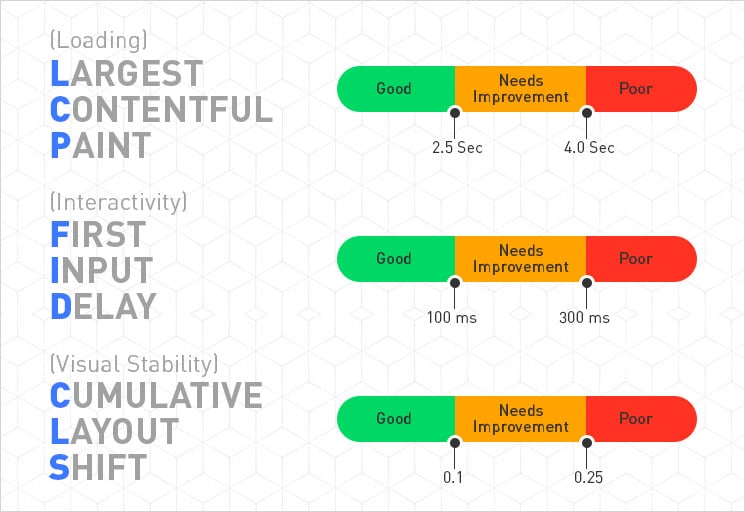
LCP measures the rendering time of the largest element that is within the visible area of the page. Google defines everything less than 2.5 seconds as a good value. Render times between 2.5 and 4 seconds are classified as in need of improvement according to Google’s Web Vital definition and everything above is considered to be poor value according to the company.
First Input Delay (FID):
FID measures the time that elapses between the first user activity and the response of the browser. What is meant, for example, is the delay that exists between the first click on a button or link and the action taken. Google regards all FID values below 100 milliseconds as good. Values between 100 and 300 milliseconds are considered to be in need of improvement and anything above that as bad.
Cumulative Layout Shift (CLS):
CLS serves as a metric for the visual stability of a website and measures how often page elements shift unexpectedly. This means, for example, asynchronously loaded page elements that suddenly change the layout of a text. But buttons, which suddenly appear completely different after being clicked, are also included, according to Google. CLS is calculated from two values that are multiplied together. Google considers the first impact fraction, by which the company refers to the percentage of the viewport that the change affects.
If an element takes up half of the page before the change and then moves down 25 per cent, it affects 75 per cent of the page and the fraction of the impact is 0.75. This value is multiplied by fraction of the distance. This is known as the greater distance that moves an element. In the previous example, the value would be 0.25. The CLS would then be 0.1875.That could already be improved, because Google only considers values up to 0.1 to be good. All values from 0.25 are classified as bad.
Core web vitals: This is how you can test your web presence!
The Web Vitals key figures LCP, FID and CLS are currently being recorded by the Chrome User Experience Report. In the long term, however, they should also appear in PageSpeed Insights and the Search Console’s speed report. Currently, both tools only measure the FID. In addition, Google is working on a Chrome extension that will show you the web vital results of a visited website directly in the browser.
Google wants website operators to record Web Vitals key figures themselves using real visitor data as far as possible. For this purpose, Google has published an open source Web Vitals JavaScript library on GitHub. The code can, for example, be integrated into your own page in conjunction with the respective analytics provider, or it can also serve as a reference for your own recording solution for Web Vitals key figures.
If you have query regard to different tools and metrics to evaluate your websites, we are happy to assist you. If you are looking to improve your website’s usability, speed, user experience, explore our UI UX web designs services! We are also providing website revamp, website redesign, online store revamp, ecommerce website revamp services, for more information, please explore our website redesign services!


